STG is stand for SNMP Traffic Grapher. This is a well-known free real-time monitoring SNMP tool for quick real-time bandwidth monitoring. It was coded by Leonid Mikhailov. Yes… Yes… it’s old, but it works out pretty well. If you feel slow Internet access, you might want to check your WAN link bandwidth in real-time which might be maxed out in any reason. Most of router stat provides minimum 30 second interval which doesn’t provide details of bustable traffic patterns occurred in 5~6 seconds. To simply check your real-time bandwidth this is one of way. Again, it’s free.
Download the file from http://www.ipBalance.com/downloads/stg.zip
or click icon
** If you cannot down load the file, probably your IE browser is blocking it. Use firefox or Copy & paste http://www.ipBalance.com/downloads/stg.zip on your browser.
See below what you need to do
Just download the file and extract it and double click file named "stg.exe".
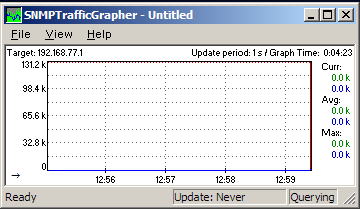
You can see below window popped up.
To quick setting go to settings under View menu tap.
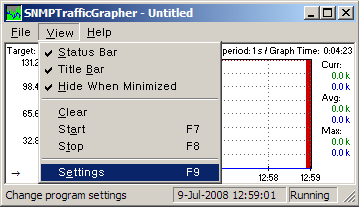
Below window will popped up. See below important parameters.
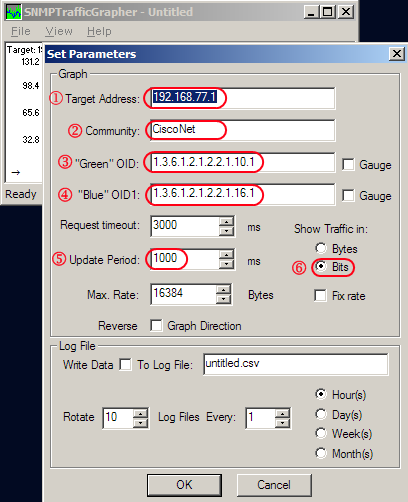
1. Target Address
– Put IP address of device that you want to pull information from. It could WAN or LAN interface, and it shouldn’t be blocked SNMP 161 to communicate with Server which this SNMP tool installed.
In this example, I used WAN IP address of a device.
2. Community
– Put Community sting as "ipBalance". You can put whatever strings you want, but common SNMP string "public" is not recommended for especially long term period of monitoring without secure plan for SNMP traffic.
** in this case, community name is "ipBalance" which must be matched with stg’s setting
ipBalance_Router#conf t
ipBalance_Router(conf)#snmp-server community ipBalance ro
** Same Cisco SNMP command can be applied on different platform such as Nortel, Tasman and Adtran
3. Green OID & Blue OID
– This is Object Identification for MIB value. Good to know details of SNMP and MIB OID, but it require a lot of reading and understanding. In this case, I will give you simple idea and tips to quick as possible.
Look at initial value from settings
1.3.6.1.2.1.2.2.1.10.1 – Green OID
1.3.6.1.2.1.2.2.1.16.1 – Blue OID
Green & Blue label is just for the look to easily separate inbound and outbound traffic on the graph
I won’t explain what is 1.3.6~~~ bla~ bla~. b/c this article become a book.
okay, here is what you need to know.
10 = inbound traffic (MIB OID = ifInOctets)
16 = outbound traffic (MIB OID = ifOutOctets)
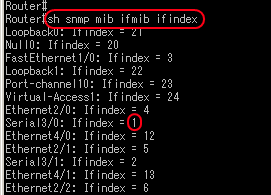
Last digit #(in this case 1) is interface index #. See below output from Cisco router(7200).
Commend: show snmp mib ifmib ifindex
or show snmp mib ifmib ifindex serial3/0 – just for the target interface
To find OIDs, check below article (click)
"How to find OIDs from device for snmp monitoring"
[ Cisco Systems Devices ]
ex) if you want to monitor Ethernet 4/0, OID value would be
1.3.6.1.2.1.2.2.1.10.12 – Green OID – Inbound
1.3.6.1.2.1.2.2.1.16.12 – Blue OID – Outbound
Free memory 1.3.6.1.4.1.9.9.48.1.1.1.6.1 (Gauge value)
Cpu load 1.3.6.1.4.1.9.2.1.56.0 (Gauge value)
[ Tasman / Nortel Devices ]
ex) if you want to monitor Tasman/Nortel 1004 router, OID value would be
1 = Ethernet
8 = Serial 1
9 = Serial 2
10 = MFR boundle interface
1.3.6.1.2.1.2.2.1.10.10 – Green OID – Inbound of MFR bundle
1.3.6.1.2.1.2.2.1.16.10 – Blue OID – Outbound of MFR bundle
– If you are collecting information thru LAN connection(consider as higher bandwidth than WAN), you can use short interval (1~3 second which is 1000~3000 ms).
However, if you are collecting information thru WAN connection, 3~6 second which is 3000~6000 ms would be better for accuracy.
[ Livingston ]
Ethernet port traffic
outgoing 1.3.6.1.2.1.2.2.1.16.1
incoming 1.3.6.1.2.1.2.2.1.10.1
Serial (Wan) port traffic
outgoing 1.3.6.1.2.1.2.2.1.16.97
incoming 1.3.6.1.2.1.2.2.1.10.97
4. Show traffic in
– In telecommunication world, we prefer to use bits unit.
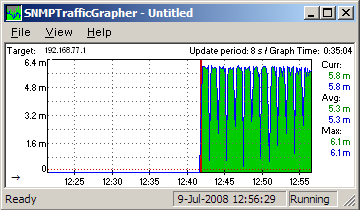
5. Update Period
Now you can see like below MRTG type of graph.
** Check CPE configuration, if see ACL is blocking port 161 which port is used by SNMP STG(SNMP Traffic Grapher) is nice tiny tool that network admin needs.
This tool can be used for any other network device to check real-time monitoring bandwidth.
I hope this is informative for you.